Surface finish in metal parts also governs the real-time performance. Appropriate exterior details yield many magnificent gains. So, you can’t negotiate with quality surface finish during metal manufacturing.
Engineers and designers keep encountering surface finish requirements constantly, almost at every step. Interpreting the symbols and measurements is mandatory to induce optimal precision with tolerances.
That’s where a well-explained surface finish chart can ease things for you, no matter where you stand. Decode finish symbols, interpret roughness metrics, and apply a surface finish effectively for your parts.
Surface Finish: An Overview
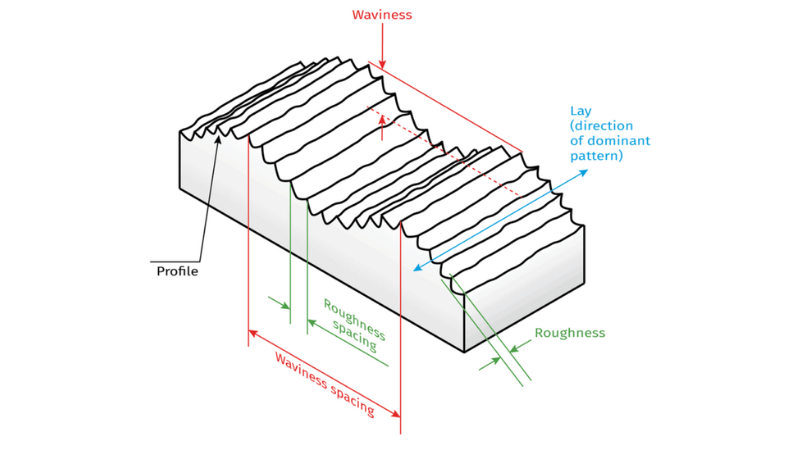
It denotes particular characteristics of a part’s surface after machining or processing. Surface finish is more like an umbrella term for roughness, surface waviness, and lay. It gets specified in technical drawings via surface roughness symbols (ASME Y14.36M or ISO 1302).
Simply, surface finish defines the overall quality of a surface (from functional and aesthetic contexts). It impacts friction, sealing, fatigue strength, coating adhesion, wear resistance, and appearance. It’s mostly measured in micrometers (µm) or microinches.
Roughness vs Surface Texture vs Surface Finish
Whenever you dig deep into surface finishing, those terms will pop up. Surface finish parameters surely are related, but not interchangeable.
- Surface Roughness: Refers to the microscopic irregularities left by machining tools. Measured using parameters like Ra, Rz, or RMS. Directly affects wear, lubrication, and fatigue life.
- Surface Texture: Broader term including roughness, waviness, and lay (predominant surface pattern). Describes the geometry of the surface at multiple scales. Important in mold-making, sealing surfaces, and powder coating.
- Desired Surface Finish: The final quality and appearance after machining, polishing, or coating. Combines roughness + texture + treatment. Balances functionality and aesthetics.
Why Correct Roughness Matters?
- Performance: Heavy roughness causes seal leakage in hydraulic systems or excessive wear in bearings. Surfaces with Ra > 2 µm in sealing applications increase leakage rates by 30% – 40%.
- Cost Efficiency: Over-specifying (too smooth) raises machining costs by up to 20% – 30% due to extra polishing. Under-specifying (too rough) leads to rework, warranty claims, and downtime.
Always match finishing specs to functional needs (lubrication vs sealing). Use profilometers or AFM (Atomic Force Microscopy) for precise measurement. Refer to ISO/ASME charts to avoid misinterpretation in RFQs and global supply chains.
Factors Affecting Surface Finish: Related Roughness Parameters (Ra, Rz, and More)
- Ra (Roughness Average)
It’s the arithmetic average of surface deviations from the mean line (center line average). Ra has been extensively used as it provides a simple and singular representation of relative smoothness.
Advantages
- Easy to measure and interpret.
- Provides a consistent baseline for comparing surfaces.
- Standardized globally (ISO 4287, ASME B46.1).
Limitations
- Ra doesn’t capture extreme peaks and valleys.
- Mask defects like scratches or chatter marks.
Applications
- Automotive: Cylinder liners (Ra = 1.0 µm) balance oil retention and friction.
- Medical implants: Titanium hip joints require Ra <0.25 µm for coating adhesion and biocompatibility.
- Electronics: Smartphone glass polishing achieves Ra <0.01 µm for optical clarity.
- Rz (Maximum Average Height of Profile)
It measures the average height difference between the five highest peaks and the five lowest valleys over a roughness sampling length. Rz is more sensitive to defects than Ra.
Advantages
- Highlights extreme irregularities that Ra may overlook.
- Useful for functional surfaces to detect sealing, fatigue, or wear resistance.
Limitations
- Results depend heavily on the sampling length.
- Less standardized across industries.
Applications
- Sealing surfaces: Hydraulic valves often specify Rz <6 µm to prevent leakage.
- Aerospace: Turbine blades require tight Rz control to minimize drag.
- Mold-making: Rz ensures cavity surfaces are defect-free for consistent product quality.
Other Relevant Parameters
- Rq (Root Mean Square Roughness)
Similar to Ra but more sensitive to larger deviations in machining processes. Used in optics and semiconductor wafers for ultra-smooth surfaces.
- Rt (Total Height of Profile)
Measures the vertical distance between the highest peak and the lowest valley. Useful in quality control to detect scratches or tool marks on surface geometry.
- Wa (Waviness Average)
Captures larger-scale undulations beyond surface roughness values. Important in bearing surfaces where vibration and noise are concerns.
Ra vs Rz: When Should Engineers Use What?
- Ra: Best-suited for general smoothness and cost-effective checks (smartphone glass polishing).
- Rz: Detecting defects, sealing, and fatigue-critical parts in hydraulic seals and aerospace blades.
Choose Ra for baseline quality control and Rz for functional performance checks. However, a combo of the two surface measurements can give a more complete picture of surface behavior.
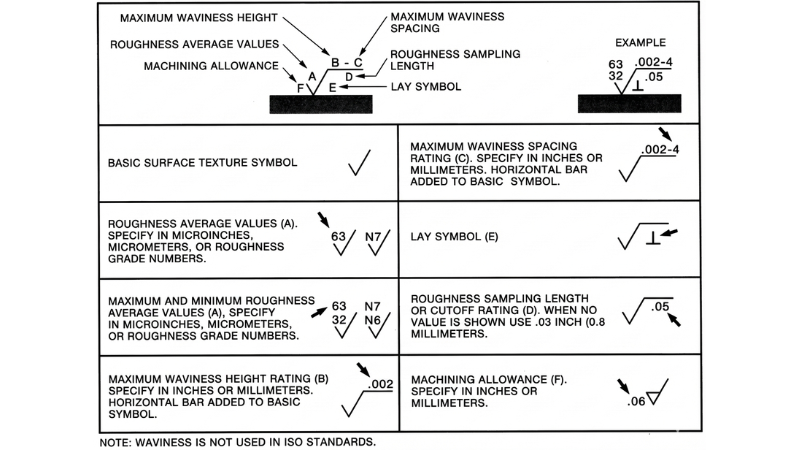
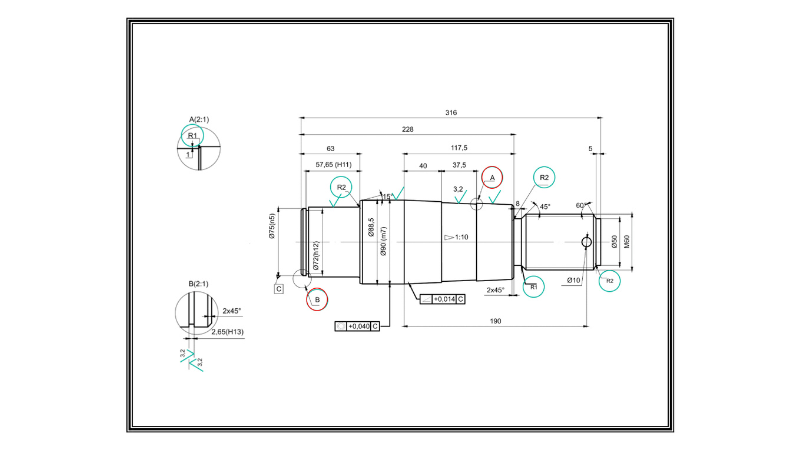
Surface Finish Symbols and Callouts (ISO 1302)
ISO 1302 defines the global language of surface finish symbols. The “check mark” symbol indicates a surface texture requirement. Meanwhile, variations and callouts specify roughness values, material removal, lay direction, and manufacturing methods.
The Basic Surface Finish Symbol
The fundamental symbol resembles a check mark or tick (two legs at 60°). It universally indicates a surface texture requirement in engineering drawings.
It only means: “this surface must meet a defined finish requirement” without additional notes. The mark lays the base upon which further specifications are included.
Additional Elements in a Surface Finish Callout
ISO 1302 allows engineers to add details to the basic symbol:
- Roughness value: Specifies the acceptable average roughness. For example, Ra 1.6 µm is common in automotive engine parts.
- Production method allowed/prohibited: Notes like “grinding only” or “no machining” guide process selection.
- Material removal requirement: A bar across the symbol indicates the requirement of material machining or removal.
- Lay direction: Arrows or letters (radial pattern) show the orientation of tool marks, critical for sealing surfaces.
- Evaluation length/measurement reference: Ensures consistency in measurement, often defined in ISO 4288.
Variants of the Symbol (ISO 1302)
- Symbol with a bar (—): Material removal required (machining, grinding).
- Symbol with a circle (○): No material removal allowed (surface must remain as-cast or as-formed).
- Symbol with additional notes: Specifies required process, such as “EDM”, “polishing”, or “lapping”.
The variants prevent ambiguity in manufacturing. For instance, specifying “no material removal” avoids unnecessary machining costs in casting.
Common Misreading of the Symbols
- Misinterpreting Ra Values vs Rz for Engineering Processes
Ra gives average smoothness, while Rz highlights peak-to-valley extremes. Confusing them can cause sealing failures. Leakage in hydraulics may increase by 30% – 40% when Rz was ignored in favor of Ra.
- Ignoring Lay Direction in Non-Contact Methods
Sealing surfaces with tool marks running parallel to the seal line often fail prematurely. In automotive gaskets, incorrect lay direction can reduce lifespan by up to 25%.
- Specifying Overly Tight Finishes with No Maximum Height
Over-specifying (e.g., Ra 0.2 µm instead of Ra 1.6 µm) can raise machining costs by 20% – 30%. Electronics industries balance cost and clarity by polishing only visible surfaces to ultra-low Ra values.
- Not Matching Roughness to Actual Manufacturing Capability
Small shops may not achieve aerospace-level finishes without specialized equipment. Misalignment between design and capability often leads to RFQ rejections or delivery delays.
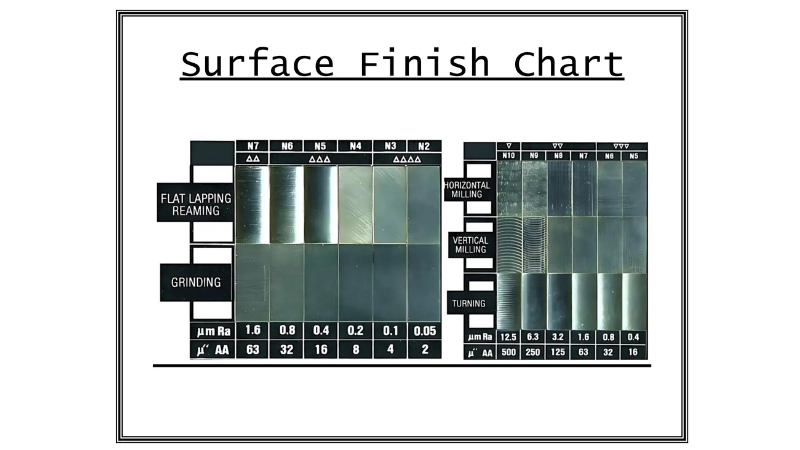
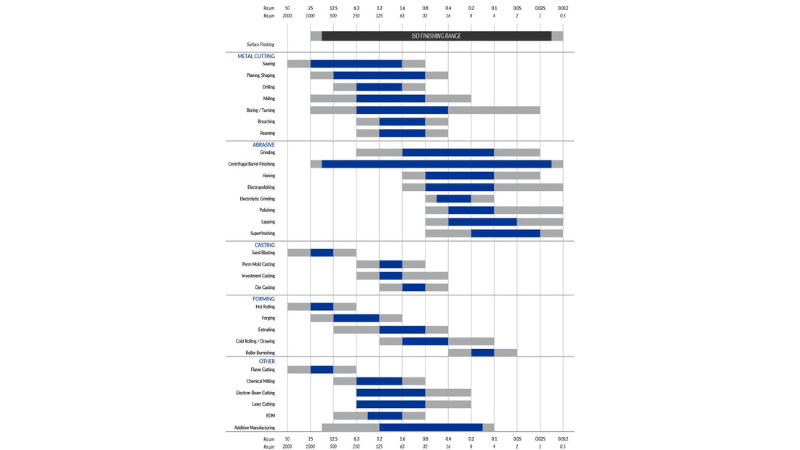
Surface Finish Chart (Ra in µm and Rz in µin)
The surface roughness chart consolidates roughness grade numbers, unit conversions, and drawing symbols. You can quickly select finishes that match function and manufacturing capability.
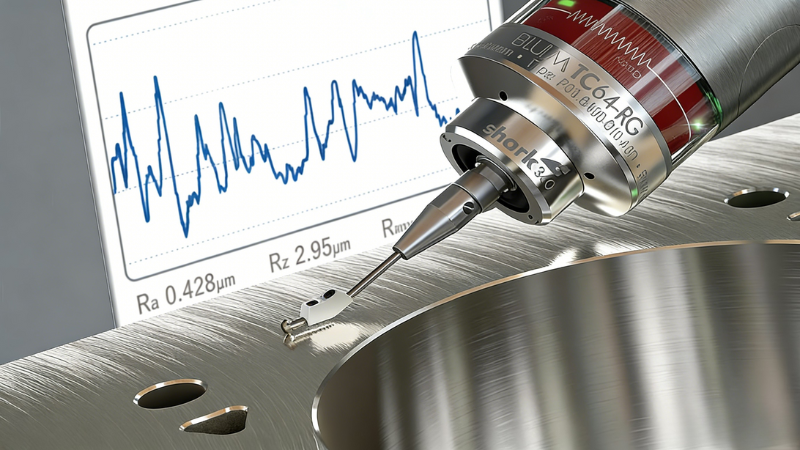
A typical CNC probe in measurement methods can detect roughness profile deviations. Conversions from micrometers to micro-inches follow the chart in machining and metrology.
Surface Roughness Comparison Chart or Surface Finish Chart
Note on Equivalence: Ra values in µm and µin map closely for industry conversion charts. Usual Rz ranges are approximate (4 – 5× Ra for machined surfaces) and should be verified per process.
Quick-Reference Chart Format
i. N1 – N4: Ultra-Fine (Polished, Lapped)
Applications: Optics, semiconductor wafers, medical implants, aerodynamic skins.
Processes: Lapping, superfinishing, nano-polishing; high inspection rigor.
Validate sampling length per ISO/ASME to avoid under-reporting peaks on ultra-smooth surfaces.
ii. N5 – N7: Fine Machining (Grinding, Honing)
Applications: Bearing journals, hydraulic sealing faces, precision fits.
Processes: Cylindrical grinding, honing, controlled lay direction.
Combine Ra with Rz for seals and fatigue-critical features; Rz catches peak-to-valley extremes Ra can miss.
iii. N8 – N10: General Machining (Milling, Turning)
Applications: Housings, brackets, non-sealing flanges, pre-finish stock.
Processes: Conventional milling/turning; optional post-process cleanup.
Specify realistic ranges aligned with machine capability and tool wear to prevent RFQ delays and rework.
iv. N11 – N12: Rough machining or cast surfaces
Applications: Structural castings, forgings, non-critical surfaces.
Processes: As-cast/as-forged; “no material removal” symbol variant when required.
Get the mostly concentric circle variant (no removal) to protect as-formed tolerances and cost targets.
Interpretation: How to Read Surface Finish Symbols on Engineering Drawings?
- How to Select the Correct Row for an Application
Function-first: Choose the lowest Ra that meets functional needs (sealing, lubrication, fatigue, aesthetics). For seals and fatigue-prone parts, include an Rz limit to control extremes.
Typical practice uses Rz ≈ 4–5× Ra for machined surfaces. Nonetheless, verify per your process capability and standard sampling length.
Process alignment: Map the target N-grade to your available process (e.g., N6 via controlled grinding/honing; N8 via fine turning). Cross-check with supplier capability to avoid RFQ churn.
- Measuring Surface Roughness Profile for Restrictions
Cost impact: Tightening from N8 (Ra 3.2 µm) to N6 (Ra 0.8 µm) may trigger grinding, added inspection, and throughput losses. Industry conversions highlight that each step toward lower Ra often requires a different process and longer cycle times.
Performance realism: If lubrication retention is needed (e.g., cylinder liners), specifying a slightly higher Ra with controlled lay can outperform an ultra-smooth finish that starves the oil film.
- Ensure the Value Aligns with Manufacturing Method
Sampling length and filters: Ra/Rz values depend on the cut-off length and measurement filtering. Also, use the same reference across design, supplier, and QC to keep readings comparable.
Symbol clarity: Add machining method notes (“grinding”, “lapping”), lay direction, and material removal indicators. It reduces misinterpretation and stabilizes costs and lead times in global supply chains.
Expert Recommendations
- Combine parameters: For sealing faces on hydraulic valves, specify both Ra and Rz (e.g., Ra 0.8 µm, Rz ≤ 4 µm) to minimize leakage and catch isolated defects that Ra overlooks.
- Use lay direction intentionally: Perpendicular lay to a seal line often improves life; include a lay symbol to prevent premature wear or leakage during service.
- Match to capability: Attach the chart row and process notes in RFQs for regional sourcing. Refer conversions (µm↔µin) for consistent vendor quotes without measurement mismatch.
- Inspection consistency: Align profilometer settings (cut-off length, filtering) with ISO/ASME practices for a fair multi-supplier comparison. Conversion charts list cut-off guides alongside N-grades for sampling.
Achievable Surface Roughness for Various Manufacturing Processes
a. CNC Milling
- Standard Roughness: Ra 1.6–3.2 µm (63–125 µin).
- Strategy: Climb milling generally produces smoother surfaces than conventional milling.
b. CNC Turning
- Standard Roughness: Ra 0.8–3.2 µm (32–125 µin).
- Better Finishes: Precision turning and wiper inserts can reduce Ra to ~0.4 µm.
c. Grinding
- Standard Roughness: Ra 0.1–0.8 µm (4–32 µin).
- Capability: Achieves extremely fine finishes, suitable for precision fits and sealing surfaces.
d. Polishing / Lapping
- Standard Roughness: Ra 0.01–0.05 µm (0.4–2 µin).
- Applications: Optical lenses, semiconductor wafers, molds, and seals.
e. EDM (Electrical Discharge Machining)
- Standard Roughness: Ra 1.0–10 µm (40–400 µin), depending on discharge energy and settings.
- Note: Leaves a recast layer that may require post-processing (grinding or polishing).
f. Casting (Aluminum / Zinc)
- Standard Roughness: Ra 3.2–12.5 µm (125–500 µin).
- Improvement Methods: Machining, shot-blasting, or polishing.
g. Additive Manufacturing (AM)
- Standard Roughness: Ra 10–25 µm (400–1000 µin).
- Challenge: Layer-by-layer deposition leaves a stair-step effect.

How to Choose the Right Surface Finish for Your Application
- Start with Function
Surface finish should always begin with functional requirements. Sealing requires smoother surfaces. Hydraulic valves, medical implants, and aerospace seals often require Ra ≤ 0.8 µm to prevent leakage.
Polished or bead-blasted finish should suffice aesthetic requirements. Consumer electronics (smartphones, laptops) use nano-polishing to achieve Ra <0.05 µm for visual clarity.
Automotive parts often bead-blast aluminum die-cast housings for a uniform matte appearance.
Controlled roughness works the best for sliding. Cylinder liners and bearings benefit from Ra ~1.0–1.6 µm to retain lubrication. Too smooth (Ra <0.4 µm) can starve oil films, increasing wear.
Roughness isn’t a critical spec for structural parts. Castings and forgings (Ra 6–12 µm) are acceptable for non-critical load-bearing parts. Steel beams in construction rarely require finishes tighter than Ra 12 µm.
- Consider Manufacturing Cost
Tighter finishes mean higher costs. Moving from Ra 3.2 µm (general machining) to Ra 0.8 µm (grinding) can increase machining costs by 20% – 30%.
Grinding or polishing adds labor hours. Precision grinding can add 15 – 20 minutes per part, impacting throughput.
EDM fine finish modes increase cycle time. Switching from rough EDM (Ra 10 µm) to fine EDM (Ra 1 µm) can double cycle time.
Profiling techniques can reveal the machine tool condition. The tool deflection from a reference line can get average values.
- Consider Lead Time
Extra finishing steps impart longer schedules. Adding polishing or lapping can extend delivery by several days in high-volume production.
High-precision surfaces require specialized equipment. Ultra-fine finishes (Ra <0.1 µm) often need superfinishing or lapping machines, which may not be available in all regions.
Ultrasonic scattering or optical scattering can get you the approximate tool life. Mechanical engineers use high resolution probe to get the product’s performance.
- Avoid Over-Specifying
Engineers may specify Ra <0.8 µm when Ra 1.6–3.2 µm is fully adequate. Such over-specification is a common mistake that increases cost and delays without functional benefit.
Automotive housings often function perfectly at Ra 3.2 µm. However, specifying Ra 0.8 µm forces grinding, raising costs by 25%.
The overall texture (statistical average) enables a surface profile of absolute value. Take five sampling lengths with a mirror finish to initiate the microscopy techniques.
Frequently Asked Questions (FAQs)
- What is the purpose of a surface finish chart?
A surface finish chart provides standardized roughness values (Ra, Rz) and symbols to specify, measure, and compare finishes. It ensures consistency and avoids misinterpretation in manufacturing.
- What standard governs surface finish symbols?
The ISO 1302 standard defines how surface texture is indicated on technical drawings. It also includes roughness values, lay direction, and material removal requirements.
- Why are surface finish symbols important in engineering drawings?
They communicate functional requirements (sealing, sliding, aesthetics) directly to machinists and inspectors. Such precautions easily prevent costly errors and delays.
- What is the difference between Ra and RMS roughness?
Ra (Roughness Average) is the arithmetic mean of deviations. RMS (Root Mean Square) is the square root of the average squared deviations. RMS is more sensitive, while Ra is simpler (more common).
- How do surface finishes affect coating adhesion?
Rougher surfaces (Ra 2–4 µm) improve mechanical bonding for coatings. Meanwhile, ultra-smooth finishes (Ra <0.2 µm) may reduce adhesion unless chemically treated.
- What instruments are used to measure surface finish?
Common tools include contact profilometers, optical interferometers, and atomic force microscopes (AFM) for ultra-fine surfaces.
- What is the lay direction symbol in ISO 1302?
Lay direction is shown with arrows or letters (e.g., ⟂ for perpendicular, ∥ for parallel). It indicates the orientation of tool marks relative to the surface function.
Conclusion
The language of surface finish includes symbols and roughness parameters. You must understand how to read and apply the standards. Only then, it is possible to design parts that perform better, last longer, and look the way they’re intended.
Optimal Surface Finishing for Metal Parts at HONJENNY
Honjenny is a top brand that has led the metal manufacturing for 30 years. Our experts guarantee your satisfaction regarding surface finish. Contact us to know how we can deliver the finish you need.
